LEARN
11-Dec-202001-Feb-2023
Advanced Linux System Monitoring with Glances
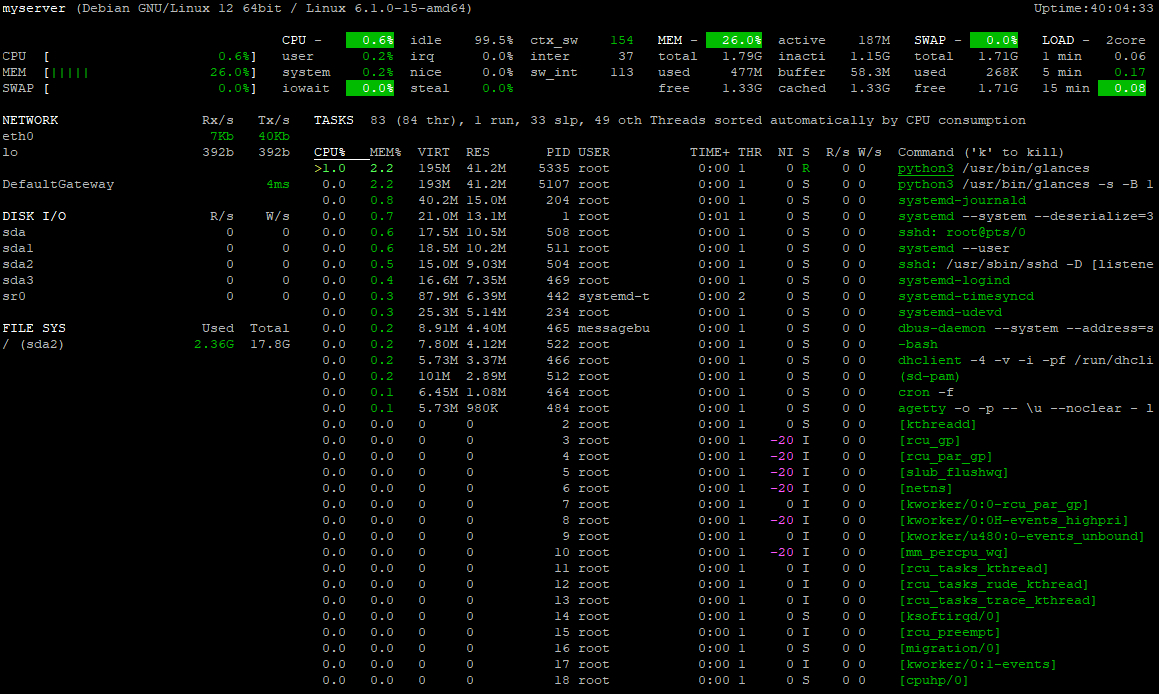
Glances stands out as an all-encompassing monitoring tool, offering a snapshot of vital system metrics in real-time. Compatible with a broad range of Linux distributions, including both Debian and Red Hat-based systems, Glances delivers in-depth visibility into CPU, memory, disk I/O, and network statistics, among others. 
1.Installation
1.1.Debian-based Systems
Glances is easily installed on Debian-based systems like Ubuntu or Debian. Use the APT package manager to handle the installation and manage all necessary dependencies.sudo apt update && sudo apt install glances1.2.Red Hat-based Systems
Installing Glances on Fedora, CentOS, and other Red Hat-related distributions typically involves using the DNF package manager, as CentOS 8 and Fedora have moved to DNF for package management. However, for CentOS 7 and earlier versions, YUM is still in use.To ensure compatibility and access to Glances on CentOS 8, you might need to enable the EPEL (Extra Packages for Enterprise Linux) repository first, as Glances may not be available in the default repositories.For CentOS 8 and Fedora (using DNF)First, enable the EPEL repository to access additional packages:sudo dnf install epel-releaseThen, install Glances: sudo dnf install glancesFor CentOS 7 and earlier versions (using YUM)On CentOS 7, the EPEL repository can also provide access to Glances. Enable EPEL and install Glances as follows: sudo yum install epel-releaseFollowed by: sudo yum install glances -y2.Launching Glances
Starting Glances is straightforward with the following single command.glancesThis opens the Glances interface, offering a real-time overview of your system’s health and performance.
3.Monitoring System Resources
3.1.CPU Usage
Glances offers detailed insights into CPU usage, clarifying how resources are distributed among processes. This information is crucial for maintaining optimal system performance. Tips:- Encountering high CPU usage can slow down your system. Use Glances to identify the top CPU-consuming processes. Once identified, consider optimizing the process’s code for efficiency or offloading some tasks to less busy times to prevent bottlenecks.
- Regular monitoring with Glances can help establish a baseline for normal CPU usage. When usage deviates significantly from this baseline, investigate background services or scheduled tasks that could be causing spikes. Adjusting their priorities or scheduling might mitigate the impact on critical operations.
3.2.Memory and Swap Utilization
Glances provides essential information on memory and swap usage, highlighting when resources are stretched thin. Tips:- If Glances shows your system frequently uses swap, this might indicate your RAM is insufficient for your workload. Before adding more RAM, review running applications to identify any that are using more memory than expected. Sometimes, configuring memory usage limits for certain applications can alleviate the need for immediate hardware upgrades.
- Analyzing swap usage trends with Glances can guide effective memory management strategies. For example, if swap usage peaks during specific operations, you might need to schedule these operations during off-peak hours or optimize them to reduce their memory footprint.
3.3.Disk I/O Performance
Monitoring disk I/O with Glances helps identify storage performance issues, crucial for applications that rely heavily on disk access. Tips:- Persistent high disk usage signals it's time to investigate. Start by using Glances to identify which processes are writing to or reading from the disk most frequently. You may discover logging verbosity can be reduced, or that it's time to partition data across multiple storage solutions to distribute the load more evenly.
- Glances can point to abnormal disk activity patterns. If you notice sudden changes in disk activity that don't align with expected usage, consider checking for unnecessary file operations or optimizing database queries to reduce disk strain.
3.4.Network Throughput
Glances keeps an eye on network throughput, a vital aspect for troubleshooting network issues and ensuring adequate bandwidth. Tips:- An unexpected increase in network traffic might indicate a problem. Use Glances to drill down into per-application network usage. This can help identify if a specific service is consuming too much bandwidth, possibly due to a misconfiguration or an ongoing attack, such as a DDoS. Implementing rate limiting on the application or using network traffic management tools can mitigate the issue.
- After making network configuration changes, use Glances to observe the effects in real-time. This immediate feedback can be invaluable for adjusting settings to achieve desired throughput levels, ensuring your network can handle both everyday tasks and peak loads efficiently.
4.Web Mode
Glances can easily be accessed remotely in web mode, simply by running the command:glances -wTo access your system's monitoring dashboard open http://your_server_ip:61208 in a web browser.Remote monitoring via web mode is particularly useful for teams. It simplifies sharing system health data and accelerates collaborative troubleshooting.For secure access, especially over the internet, consider using an SSH tunnel or a VPN to connect to the Glances web interface.The content of this document is licensed by Interspace under the MIT License
Next: Windows
Related content
Documentation

Cloud

Communications

Hosting

My Interspace
Tech Articles

Tutorials

Learn
News

Latest news

Latest events
Related products

Elastic Cloud VPS
Elastic Cloud VPS is a virtual machine running on advanced cloud and networking technologies, offering superior advantages over traditional VPS hosting at an exceptional price-to-performance ratio.
Deploy OS and apps in just 1 min. One-click geo-redundant backups, snapshots and disaster recovery. Next-generation AMD EPYC processors, ultra-fast NVMe storage, dedicated connections and free private networking.

Premium Internet Access
Highest-grade Internet access for professional needs. Superior point-to-point fiber-optic link, symmetrical down/up speed, unlimited traffic, SLA 99.9% and static IP. Direct connections to the top tier 1 global providers.
Our network architecture is passionately designed to ensure the highest quality connections to any destination worldwide, boasting unmatched transfer speeds and multi-tier redundancy.

Dedicated Servers
Dedicated servers on high-grade hardware from well-known sever vendors. They are hosted in our own data centers, enabling us full control in safe-guarding the uptime 24/7. Selection of primary data centers and a disaster recovery one located at a safe distance.
Power control options (reset, power off/on) and free of charge KVM-over-IP available 24/7 on a single click, including support to remotely boot/install your own ISO images.
 English
 Deutsch
 Македонски
 Slovenščina
 Srpski
 Shqip
Shqip Български